Everything your station has seen, ready to read.
Pick a day, a week, a season or a range of your own. Wind, temperature, rain and comfort redraw from your station's history, and any of it can leave as a PDF or a spreadsheet.
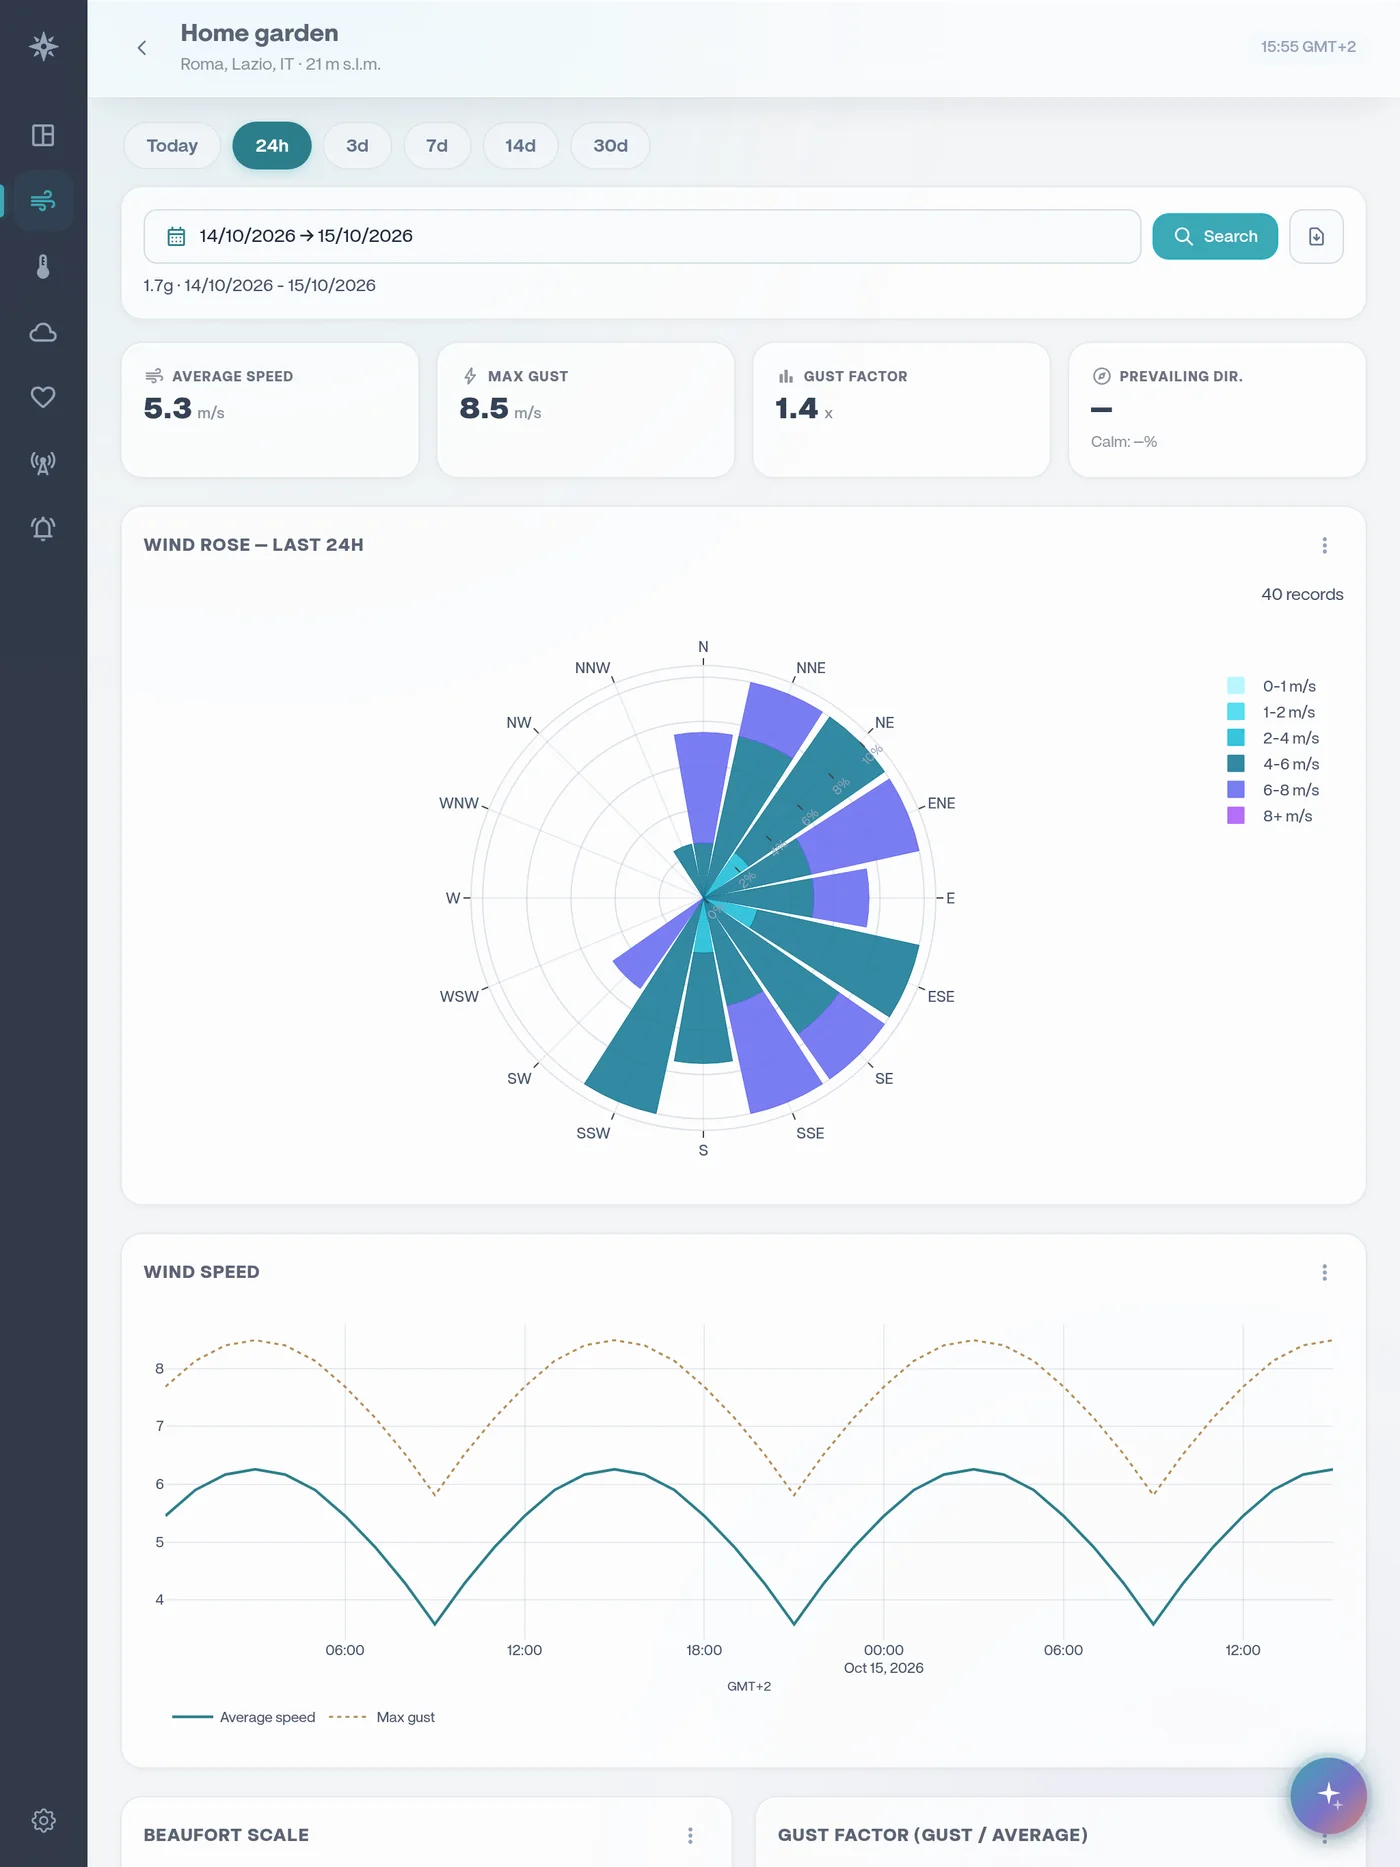
Wind
A wind rose for any period, wind speed and gusts, the gust factor, the Beaufort scale and a polar scatter of every reading. On Business, the historic fallout map shows where the wind carried things over the same period.
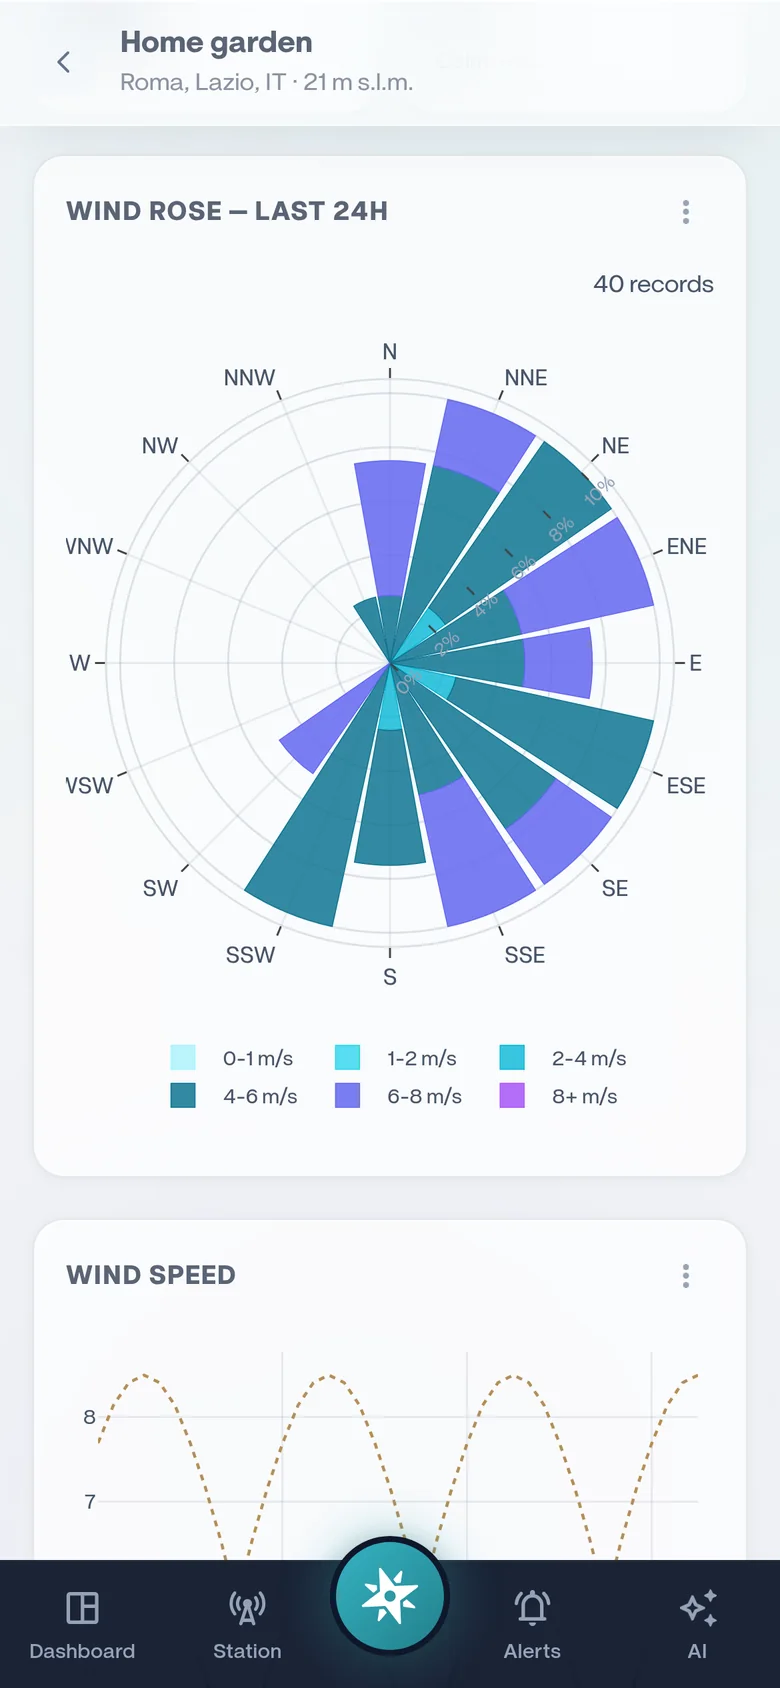
Temperature and pressure
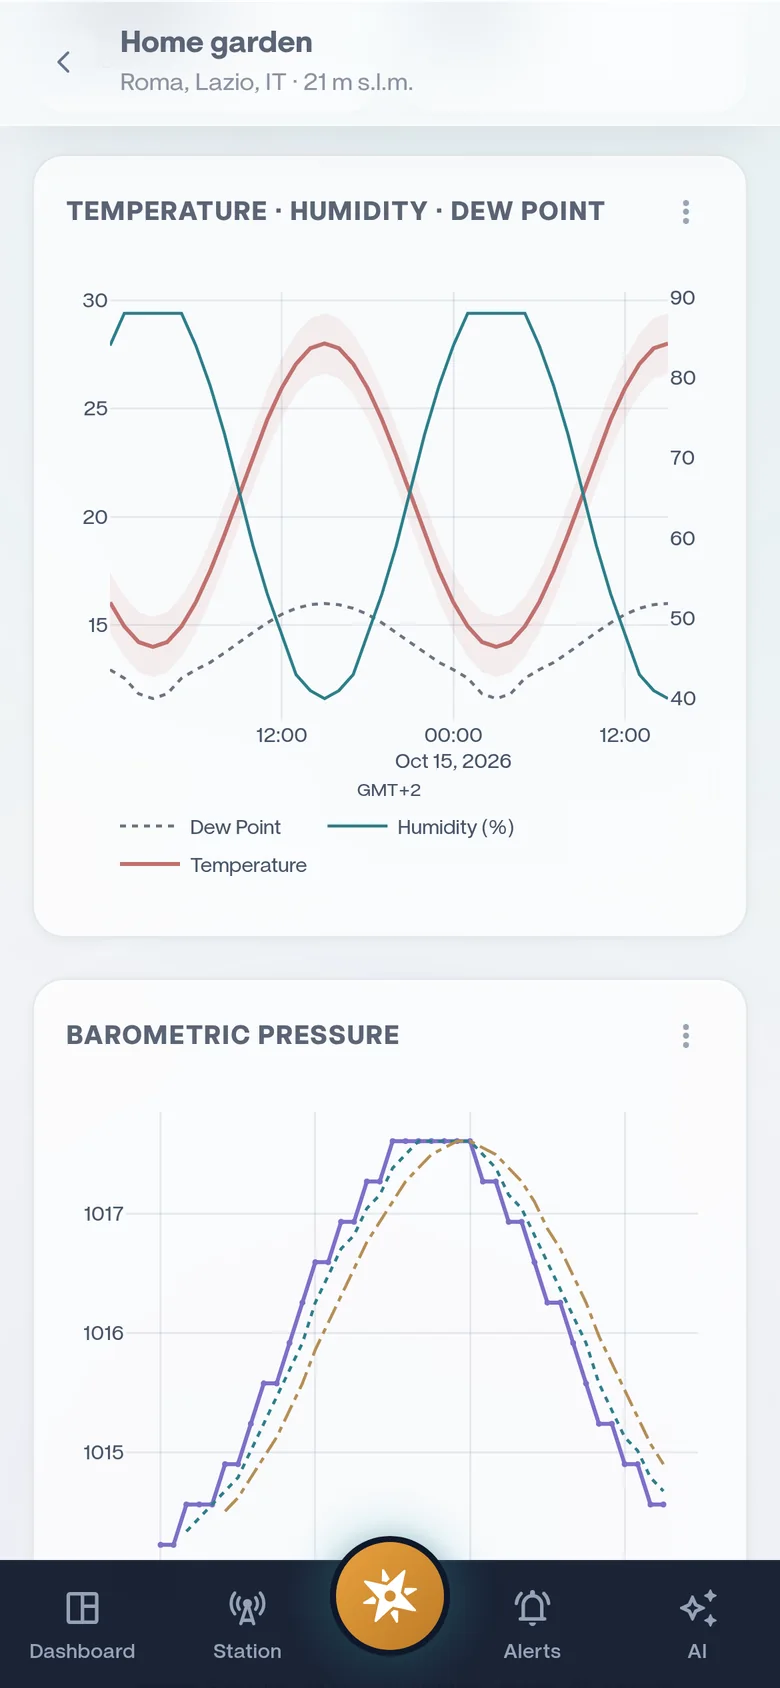
Temperature, humidity and dew point on one chart, barometric pressure with its 3-hour and 24-hour averages, and how fast it is changing.
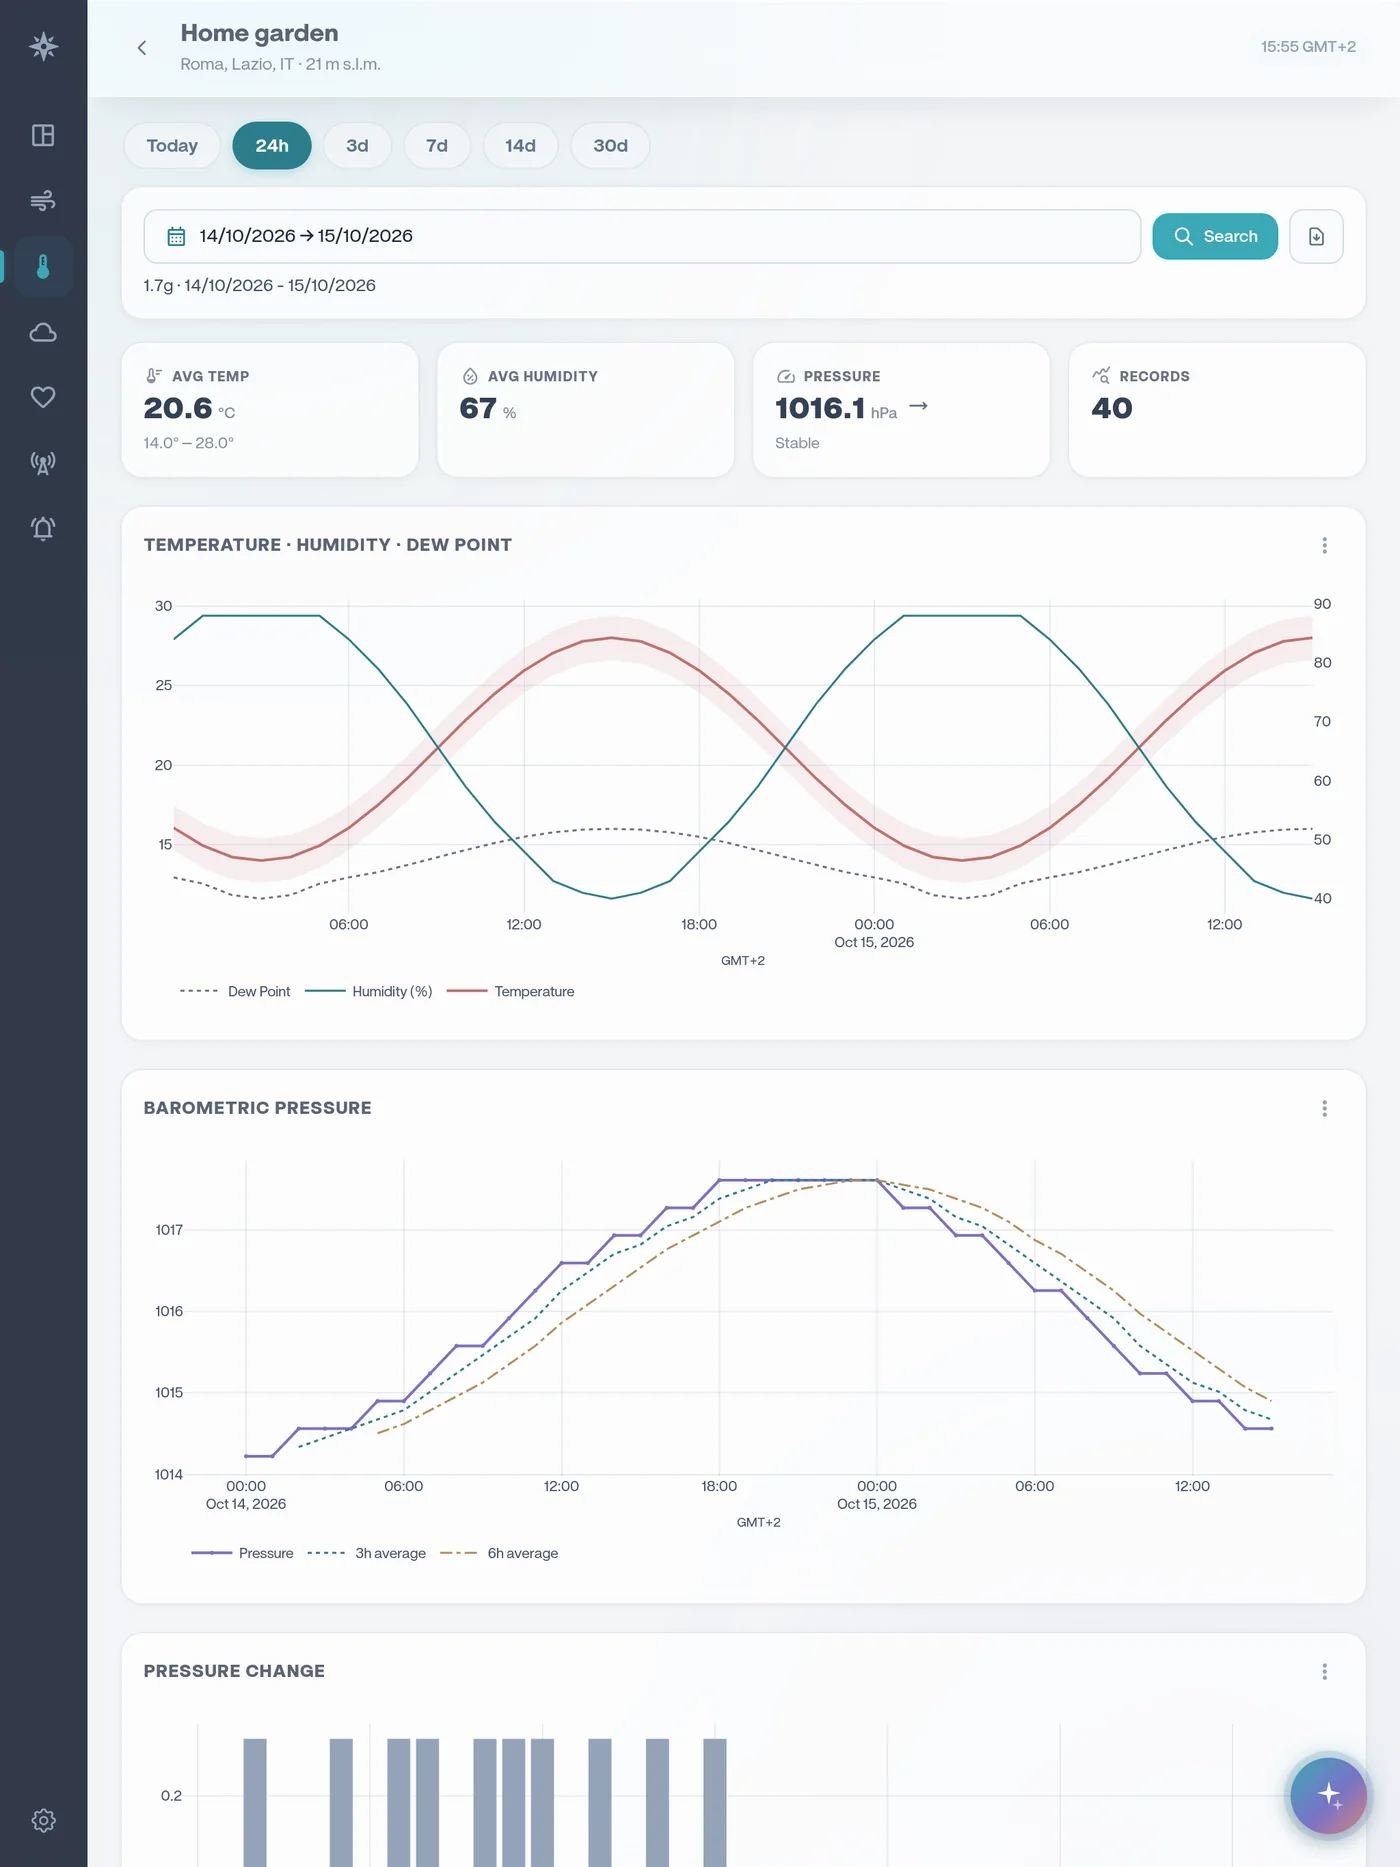
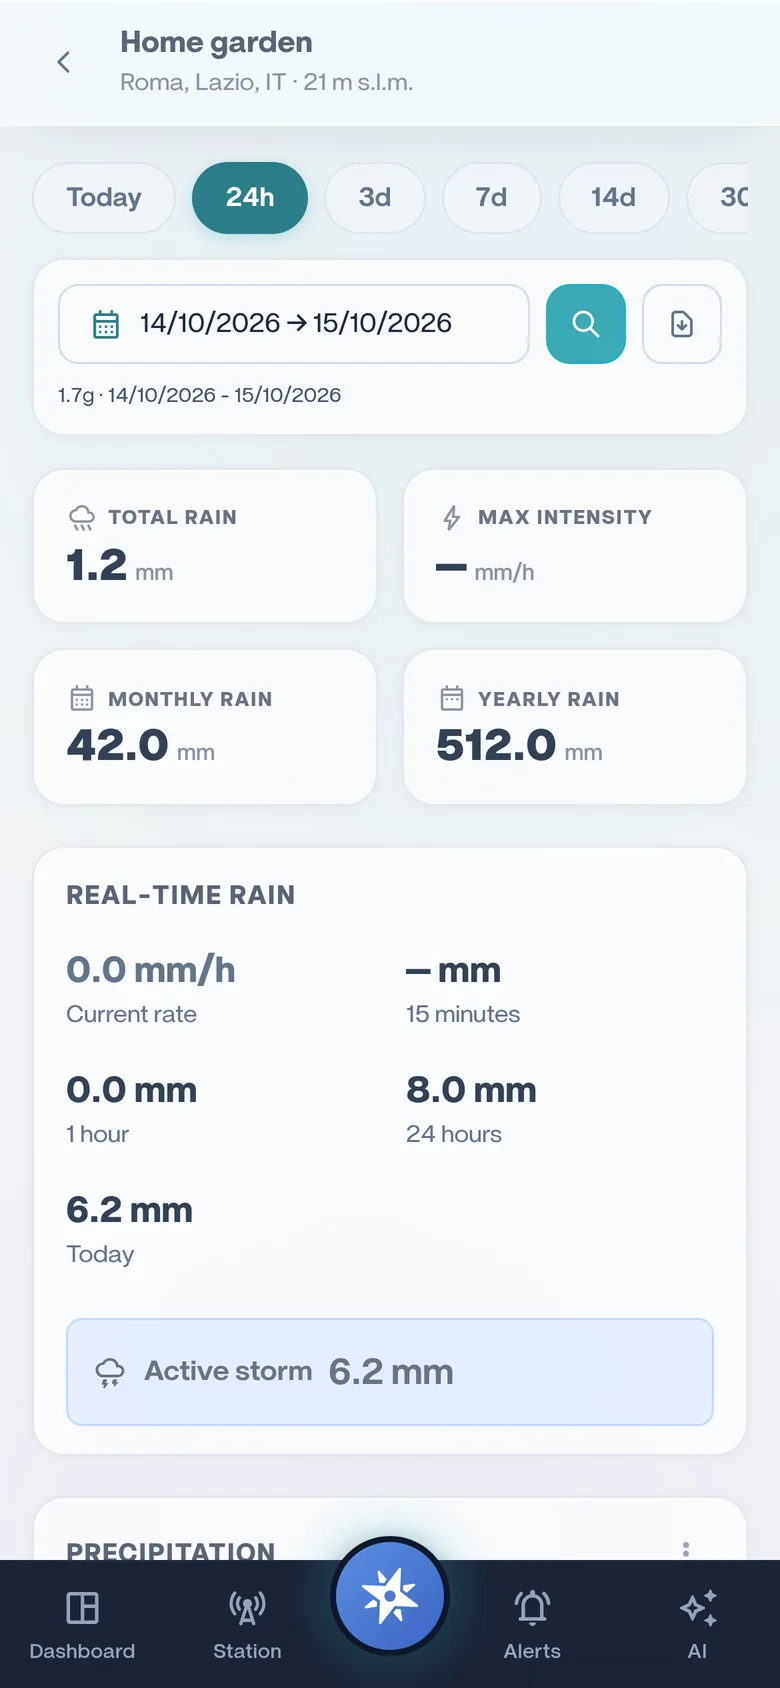
Rain
Today, this month and this year at a glance, real-time rate and intensity, storm totals, plus solar radiation and UV over the same days.
Comfort
Heat index, wind chill, wet bulb and the thermal comfort index (UTCI) over time, with the dew point spread that tells you when fog is coming.
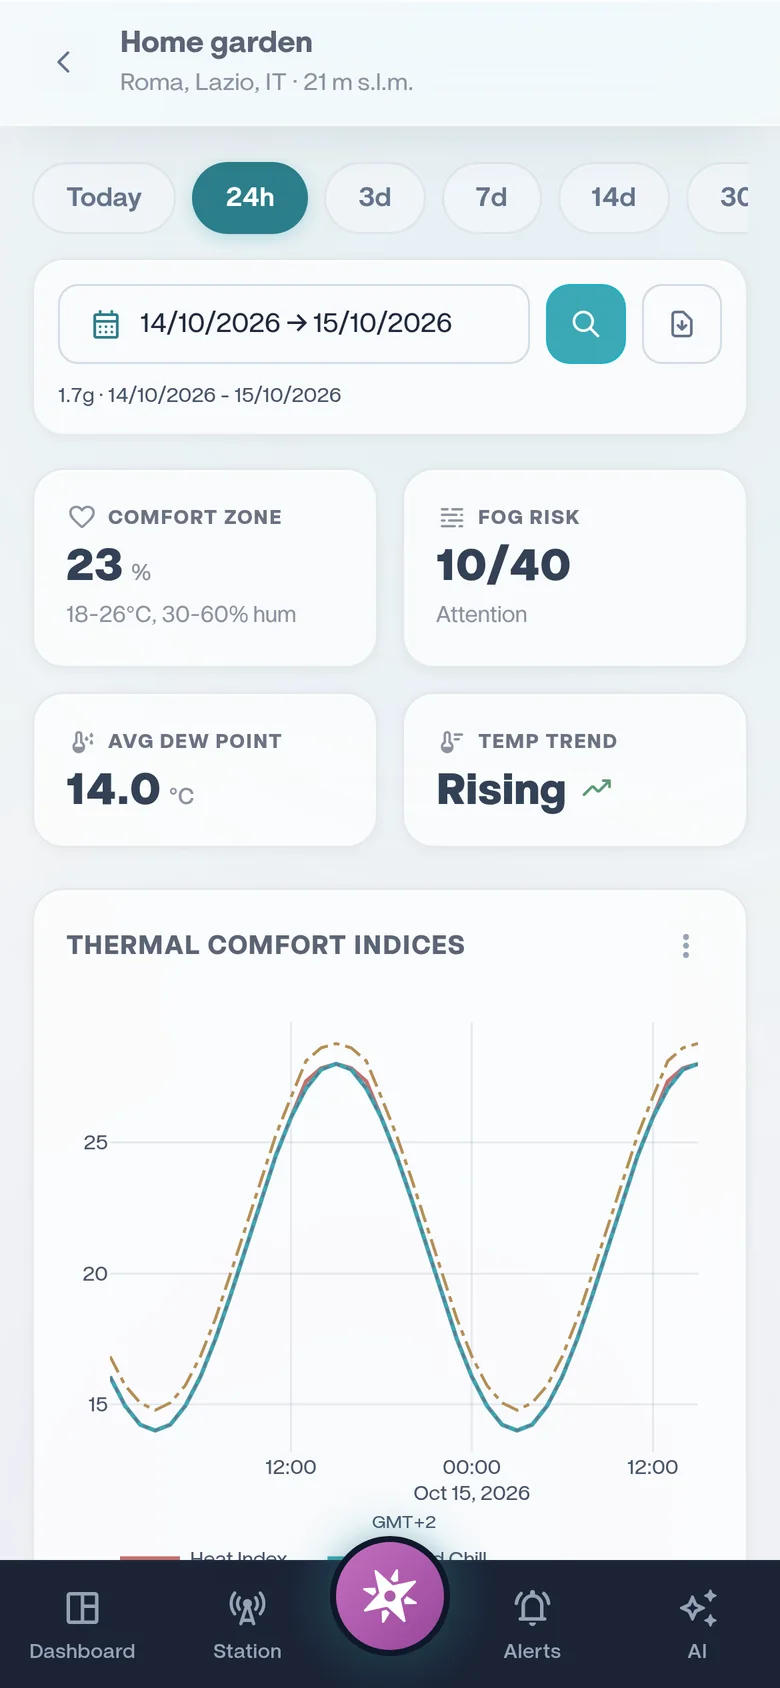
Any window you want.
Today, 24 hours, 3, 7, 14 or 30 days, or a range of your own, down to the time of day. History comes from your maker's cloud where it keeps one, and WindRose builds it from the live readings everywhere else.
- 3 months of full-resolution history on Free, 2 years on Pro, unlimited on Business; daily summaries forever on every plan
- Ranges stop where your station's archive begins, so nothing looks empty by mistake
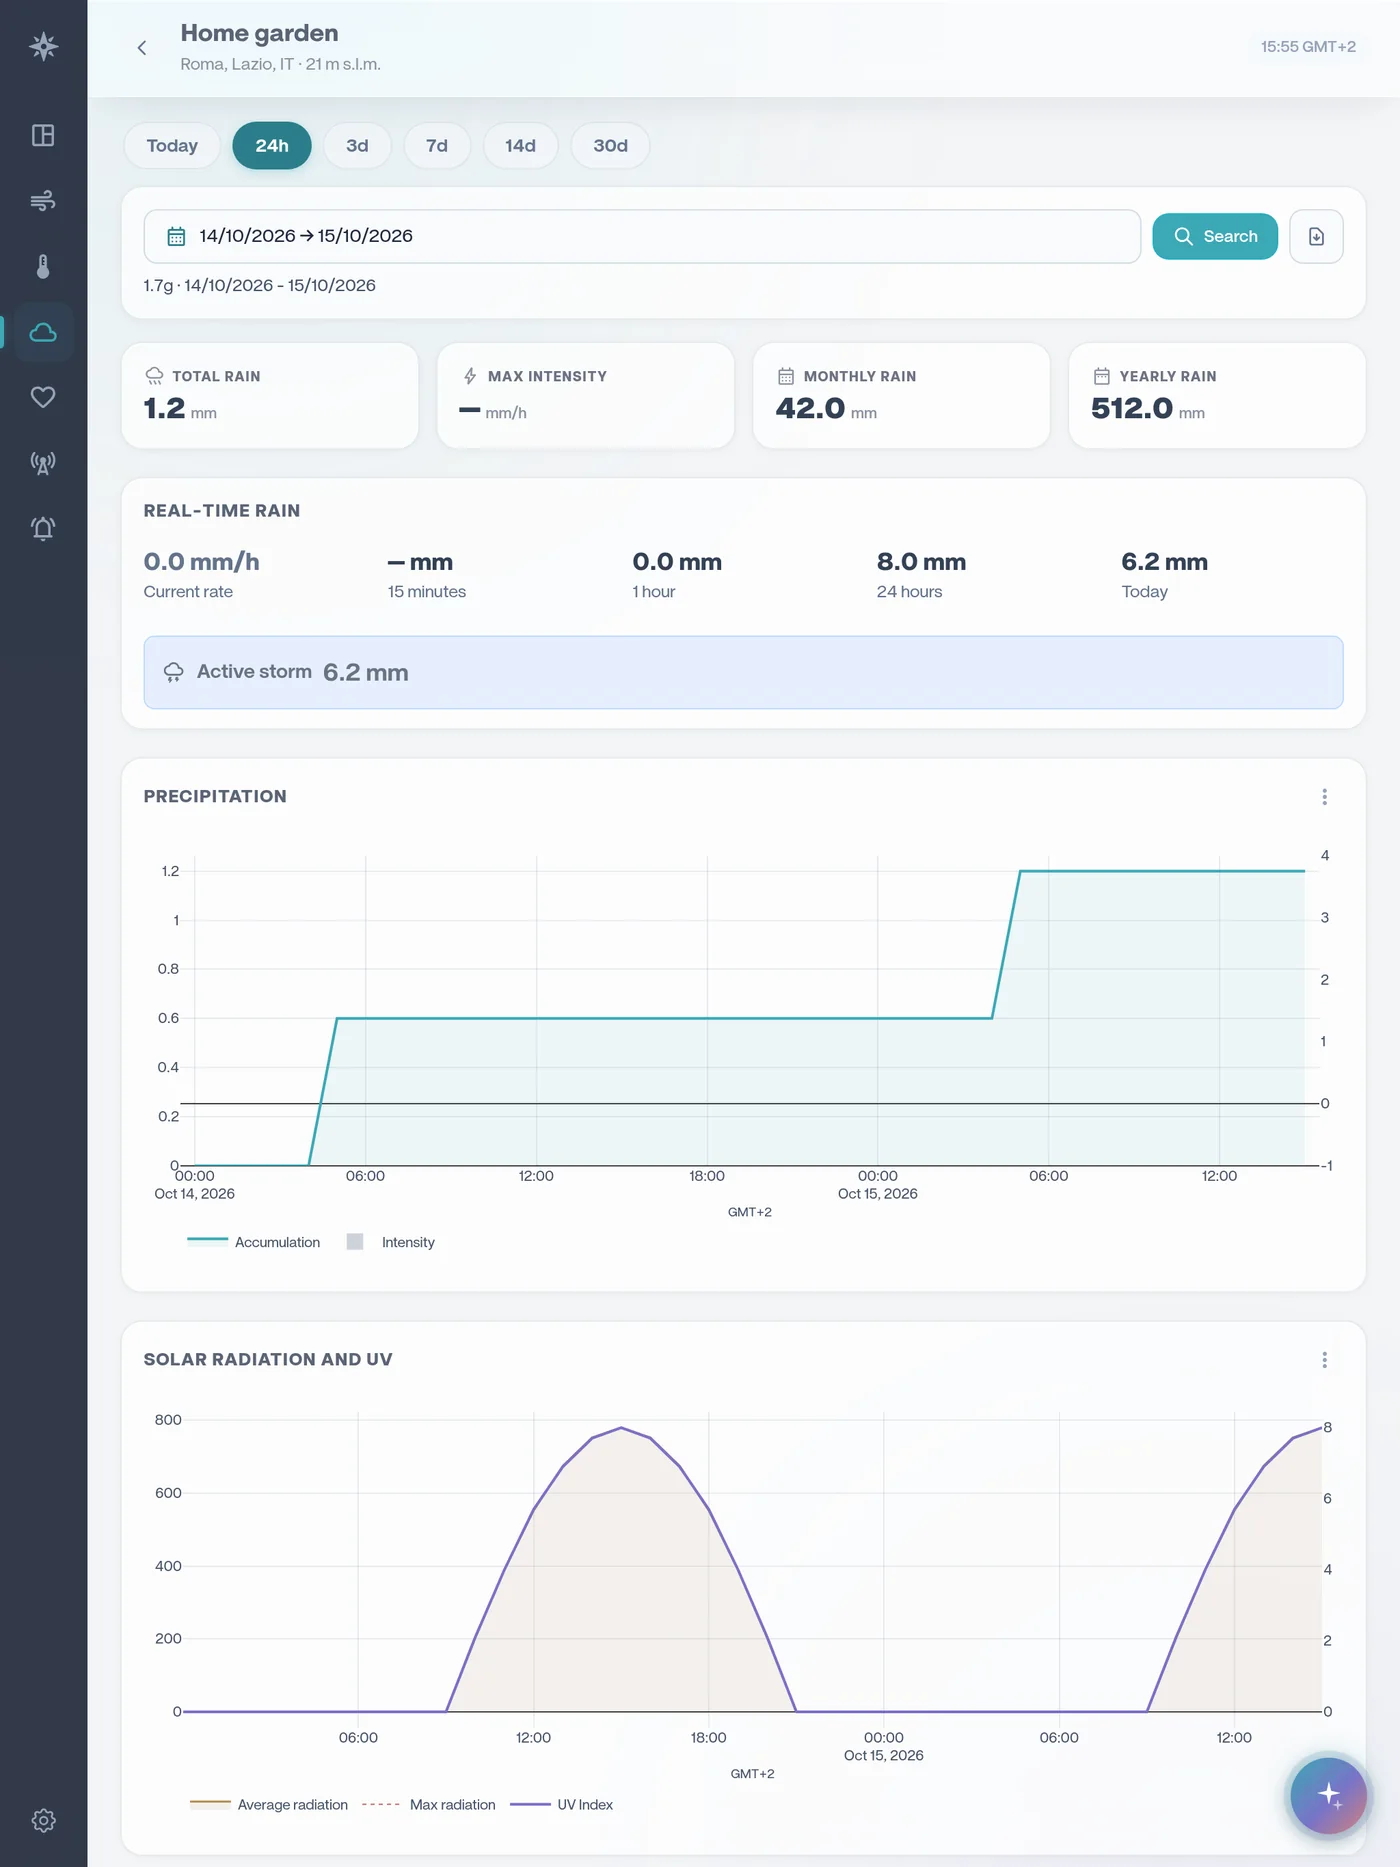
Take it with you.
Download any view as a PDF report or the readings as CSV. Every plan can also record high-frequency windows on a schedule, for the afternoon of a trial or the night of a frost.
- PDF reports: 3 a month on Free, unlimited on Pro and Business
- Scheduled high-frequency recordings with CSV export: 3 a month on Free, unlimited on Pro and Business
Try it on your own station.
Free for one station, no card needed. Upgrade only if you want more.