Models you can check, from data you own.
Beyond the readings, WindRose computes the indices and models that safety, agronomy and environmental work rely on. Every method is named, and every input comes from your own station.
Where the wind carries it.
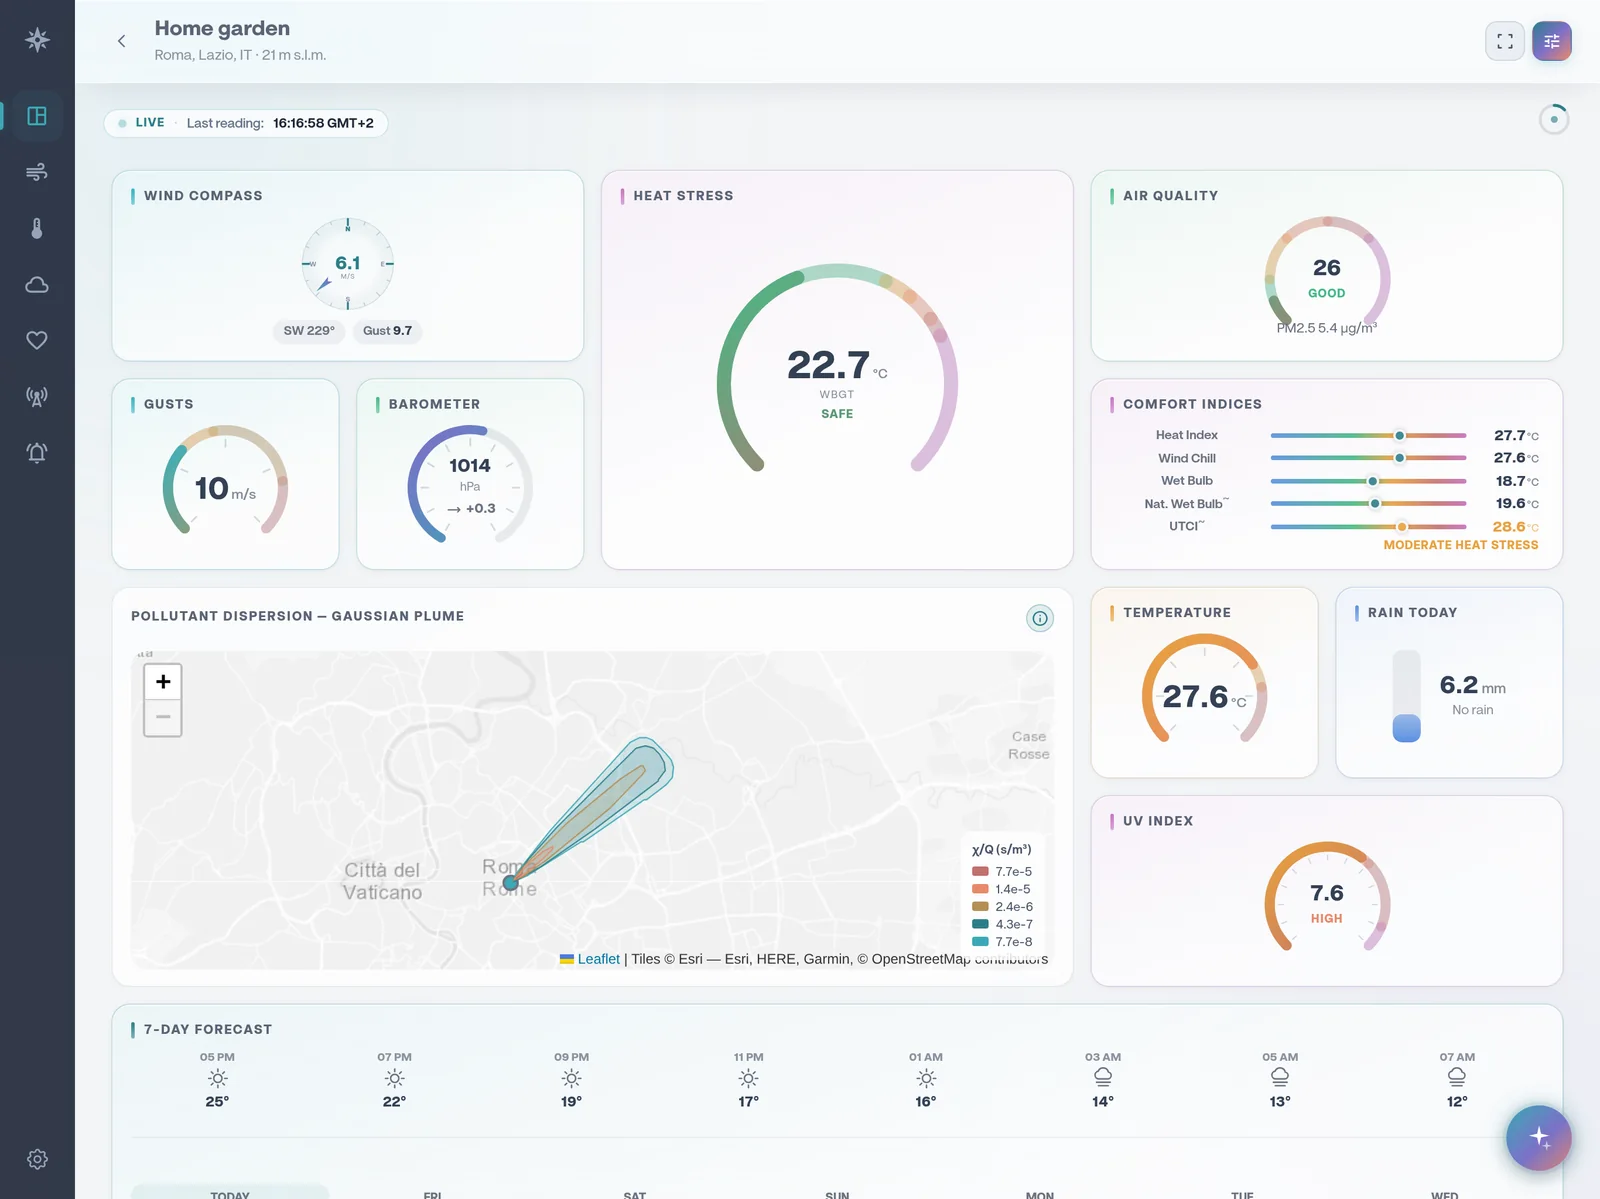
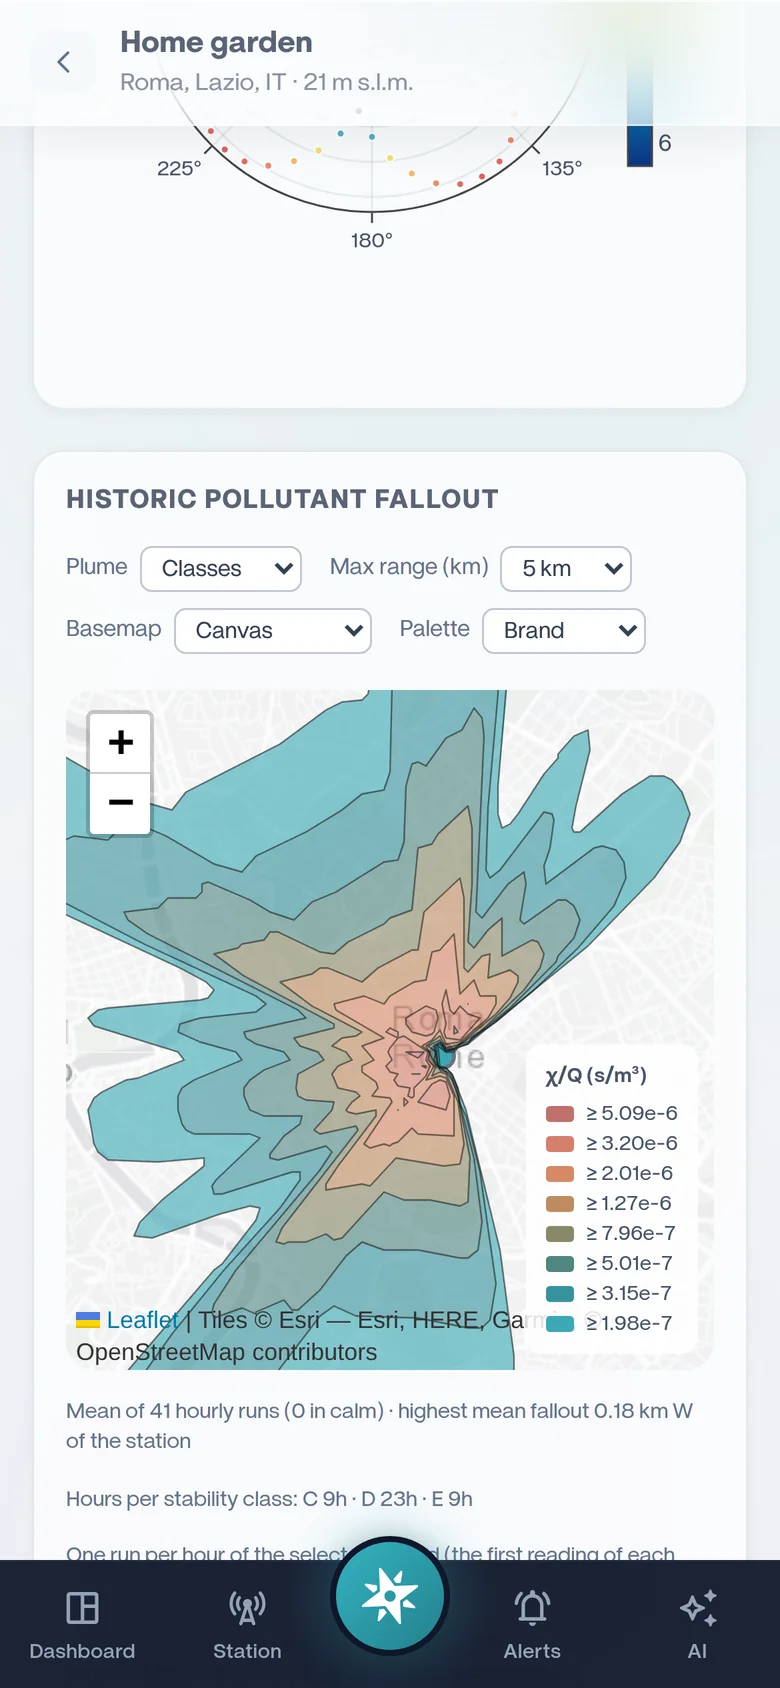
A Gaussian plume model runs on your station's live wind and stability and draws the plume on a map: normalised χ/Q, or concentrations in µg/m³ once you declare your stack (height, diameter, exit gas, emission rate, position). The historic fallout map averages one run per hour over any period you choose, as a map or in 3D with an hour-by-hour playback, so you can see where emissions, odour or spray actually went.
- Pasquill–Gifford stability classes, rural σ curves from EPA ISC3 or Briggs
- Weak-wind model (Cirillo–Poli) below 1 m/s, with Yamartino σθ from your own readings
- Live map card and historic fallout map in 2D and 3D, on Business
Can the crew keep working?
Wet-bulb globe temperature is the reference index for heat stress at work. WindRose computes it from temperature, humidity, wind and solar radiation, shows it with its risk bands, and can alert you when it crosses your threshold.
- WBGT estimated with the Liljegren et al. (2008) model; ISO 7243 defines the index and its risk bands
- Natural wet bulb and globe temperature alongside
The methods, in full.
| Index | What it tells you | Method |
|---|---|---|
| WBGT | Heat stress for people working or exercising outdoors | Estimated with Liljegren et al. (2008); index and risk bands per ISO 7243 |
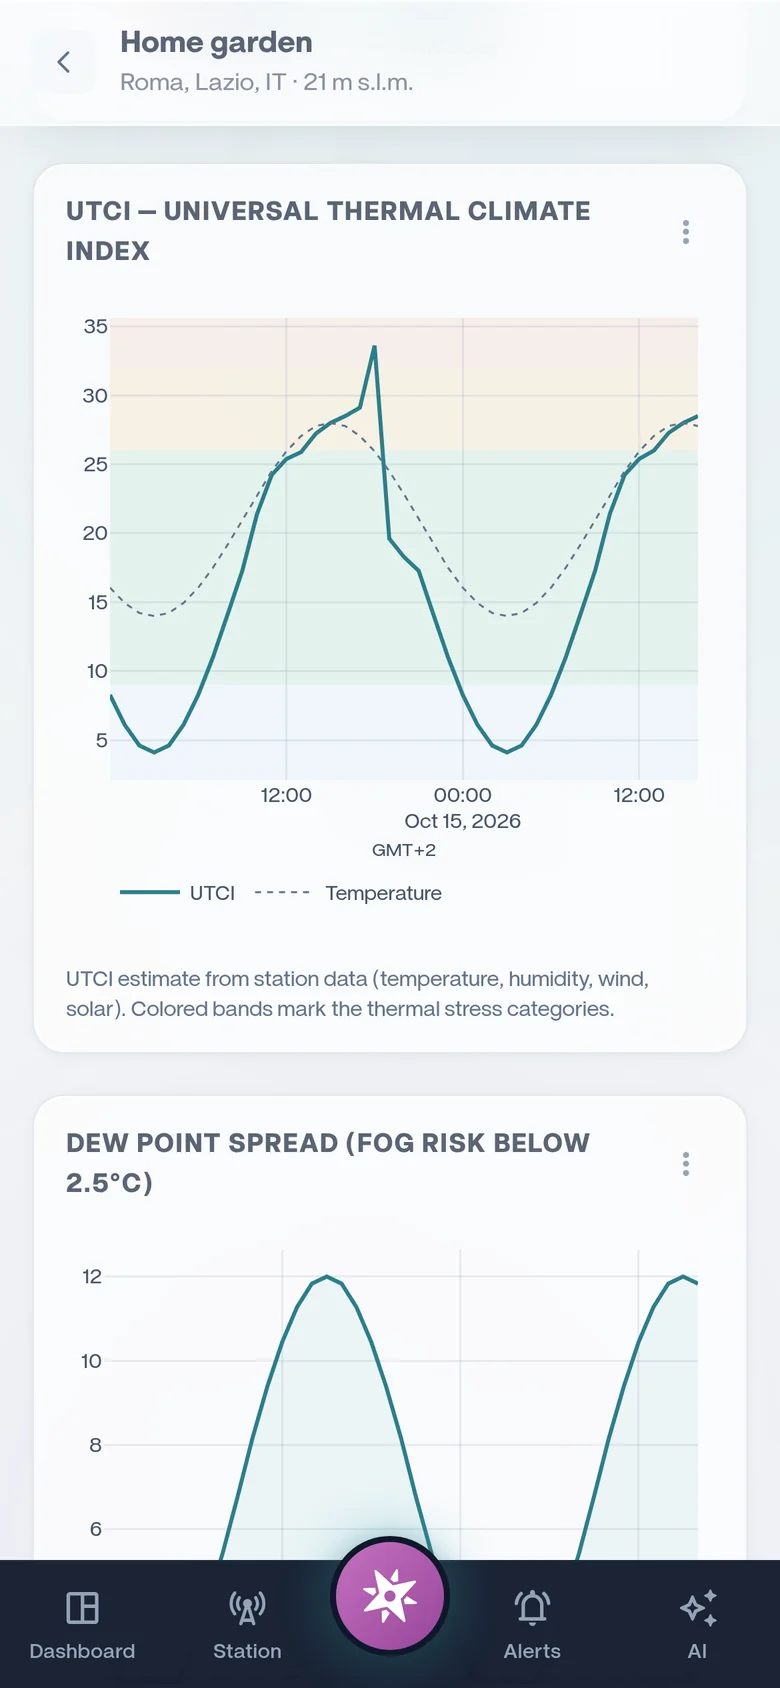
| UTCI | How the weather feels to the human body, in ten stress categories | Bröde et al. (2012) operational polynomial |
| Air quality (AQI) | Air quality from particulate readings, current, 1-hour and NowCast | US EPA AQI breakpoints and NowCast |
| Dispersion (χ/Q or µg/m³) | Where and how strongly a release spreads downwind | Gaussian plume, Pasquill–Gifford classes, ISC3 or Briggs σ, Cirillo–Poli under weak wind |
| Heat index, wind chill, THW | Apparent temperature in heat and in wind | As reported by your station's console or provider |
| Dew point spread | How close the air is to fog and dew | Temperature minus dew point |
| Leaf wetness and infection risk | Hours of wet leaves, and how favourable the moment is for foliar fungi | Your station's leaf wetness sensor; a temperature × wetness risk matrix (a screening view, not a crop-specific disease model) |
Built for work, not just for weather.
One account for a farm, a site or a network, with a board for each.
Your readings and indices in your own systems, or in your own AI tools.
Reports and embeds that carry your name instead of ours.
A reseller plan to manage your customers' stations under one roof.
Try it on your own station.
Free for one station, no card needed. Upgrade only if you want more.